- Sales of $347.8 million for the quarter and $1.005 billion for the nine-month period
- Adjusted EBITDA1 of $18.9 million for the quarter and $69.4 million for the nine-month period
- Net income of $8.8 million, or $0.33 per diluted share for the quarter and net income of $2.9 million, or $0.11 per diluted share for the nine-month period
- Net income includes a non-cash valuation allowance on deferred tax assets of $0.9 million or $0.03 per diluted share in the third quarter and $30.2 million or $1.12 per diluted share for the nine-month period
- Operating results continue to be significantly impacted by changes in foreign currency exchange rates
- Total backlog of $3.005 billion as of June 30, 2015
- Cash used in operating activities of $14.6 million for the quarter and cash provided by operating activities of $46.5 million for the nine-month period
SAN DIEGO, Calif. - August 6, 2015 – Cubic Corporation (NYSE: CUB) today reported its financial results for the quarter and nine months ended June 30, 2015.
Third Quarter Results
Sales for the third quarter of fiscal 2015 were $347.8 million compared to $340.4 million in fiscal 2014, an increase of 2 percent. In the third quarter, sales continued to be significantly impacted by changes in foreign currency exchange rates. Foreign currency exchange translation reduced sales by $14.6 million for the quarter when compared to prior year exchange rates. Sales from recent acquisitions for the third quarter of fiscal 2015 were $25.5 million compared to $14.7 million last year.
Operating income for the quarter decreased 46 percent to $10.3 million from $19.2 million last year, primarily as a result of expenditures related to strategic and IT system resource planning as part of our One Cubic Initiatives totaling $5.3 million for the quarter. Foreign currency exchange translation further reduced operating income by $1.6 million.
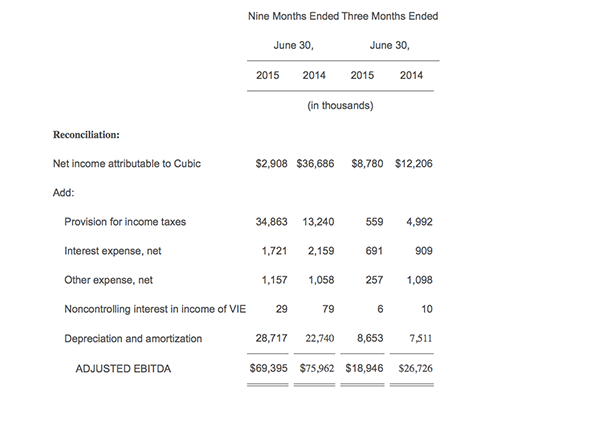
Adjusted EBITDA1 was $18.9 million or 5.4 percent of sales for the quarter compared to $26.7 million or 7.9 percent of sales in the third quarter of fiscal 2014.
Net income attributable to Cubic shareholders was $8.8 million, or $0.33 per diluted share, compared to $12.2 million, or $0.45 per diluted share, in the third quarter of fiscal 2014.
Net income includes a non-cash valuation allowance on U.S. deferred tax assets of $0.9 million or $0.03 per diluted share for the quarter.
First Nine Months Results
Sales for the first nine months of fiscal 2015 were $1.005 billion compared to $1.002 billion in fiscal 2014, an increase of less than 1 percent. Sales from recent acquisitions for the first nine months of fiscal 2015 were $66.3 million compared to $32.8 million last year. Foreign currency exchange translation reduced reported sales by $32.6 million, or 3 percent year-to-date.
Operating income was $40.7 million in the first nine months of fiscal 2015 compared to $53.2 million in fiscal 2014, a decrease of 23 percent. Operating income was impacted by a restructuring charge in the second quarter of fiscal 2015 totaling $5.4 million, costs related to an audit committee investigation totaling $3.0 million and $7.8 million of expenditures related to new strategic and IT system resource planning efforts. Foreign currency exchange translation further reduced operating income by $4.6 million.
Adjusted EBITDA1 decreased 9 percent to $69.4 million or 6.9 percent of sales for the first nine months of fiscal 2015 compared to $76.0 million or 7.6 percent of sales in fiscal 2014.
Net income attributable to Cubic shareholders was $2.9 million, or $0.11 per diluted share, compared to net income attributable to Cubic of $36.7 million, or $1.36 per diluted share, in the first nine months of fiscal 2014.
Net income includes a non-cash valuation allowance on U.S. deferred tax assets of $30.2 million or $1.12 per diluted share for the nine-month period.
Total backlog was $3.005 billion at the end of the quarter compared to $3.180 billion at September 30, 2014, a decrease of $175.5 million. Decreases in backlog for Cubic Transportation Systems (CTS) and Cubic Global Defense (CGD) Services were partially offset by an increase in CGD Systems. Changes in currency exchange rates between September 30, 2014 and June 30, 2015 reduced backlog by $71.3 million.
“Our third-quarter results were mixed primarily driven by slower-than-expected sales growth, due to the ongoing negative impact of foreign currency exchange rates, and the continuing investments in enterprise systems” said Bradley H. Feldmann, president and chief executive officer of Cubic Corporation. “We expect to close out the fiscal year with a strong fourth quarter led by strong performance in our defense systems business.”
(1) Adjusted EBITDA is a Non-GAAP metric - see the table included in the section titled “Use of Non-GAAP Financial Information” for a reconciliation of these GAAP and non-GAAP financial measures.
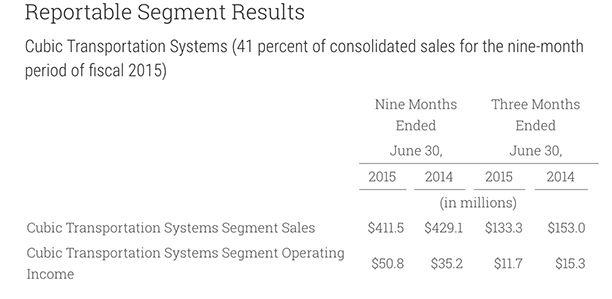
CTS sales decreased 13 percent in the third quarter to $133.3 million compared to $153.0 million last year, and decreased 4 percent for the nine-month period to $411.5 million from $429.1 million last year. Changes in foreign currency exchange rates reduced sales by $11.3 million for the third quarter and $26.0 million for the nine-month period compared to the same periods last year. Sales were lower for the quarter and nine-month period on contracts in Sydney and in the U.K.
CTS operating income decreased 24 percent in the third quarter to $11.7 million compared to $15.3 million last year. For the quarter, the decrease in operating income is the result of a $1.1 million impact of foreign currency exchange rates, an increase in R&D expenditures and lower operating income on work performed on U.K. development and service contracts. These decreases were partially offset by decreased losses on a development contract in Vancouver which experienced less cost growth in 2015 than in 2014.
CTS operating income increased 44 percent for the nine-month period to $50.8 million from $35.2 million last year. The increase in operating income was primarily attributable to a decrease in losses experienced on the Vancouver contract, an increase in gross margins on a contract in Chicago and a gain recognized on proceeds from a claim settlement of $3.6 million. These increases in operating income were partially offset by slightly lower margins on development and services work in the U.K. and a $3.5 million impact of changes in foreign currency exchange rates.
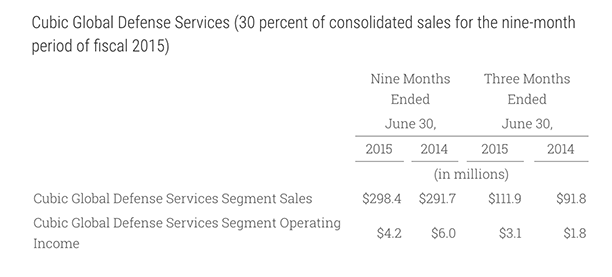
CGD Services sales increased 22 percent in the third quarter to $111.9 million compared to $91.8 million last year, and increased 2 percent for the nine-month period to $298.4 million compared to $291.7 million last year. Sales for the third quarter were higher primarily because of increased activity at the Joint Readiness Training Center in the third quarter, due to a Marine Corps training contract won earlier in the fiscal year and growth in the simulator training business. For the first nine months, higher sales from the Marine Corps contract and simulator training business were partially offset by lower sales from other contracts and a general reduction in the number of training exercises and other support requirements for U.S. government customers.
CGD Services operating income increased 72 percent in the third quarter to $3.1 million compared to $1.8 million last year, and decreased 30 percent for the nine-month period to $4.2 million from $6.0 million last year. The increase in operating income for the third quarter resulted from a decrease in amortization expense related to purchased intangible assets and higher sales volume. However, although sales increased in the quarter over the prior year, profit margins decreased due to competitive pressures driving down bid prices. For the nine months, profit margins were lower than in the comparable period of the prior year due to budget pressures and new contracting standards by the Department of Defense, and due to higher compensation costs than normal during the first quarter of fiscal 2015 as the result of recruiting new executive management. In addition, we incurred restructuring charges of $0.3 million in the second quarter of 2015. Lower operating income for the nine-month period was partially offset by a decrease in amortization expense related to purchased intangible assets.
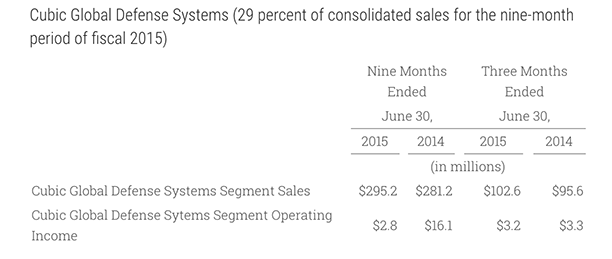
CGD Systems sales increased 7 percent in the third quarter to $102.6 million compared to $95.6 million last year, and increased 5 percent for the nine-month period ended June 30, 2015 to $295.2 million from $281.2 million last year. Sales were higher from air combat training systems and due to the acquisition of businesses. These increases were partially offset by lower sales on ground combat training systems and simulation systems for the quarter and nine-month periods.
CGD Systems operating income decreased 3 percent in the third quarter to $3.2 million compared to $3.3 million last year, and decreased 83 percent for the nine-month period to $2.8 million from $16.1 million last year. Operating income decreased for the quarter and nine-month period driven by losses on a training system contract due to cost growth, reduced operating income on lower sales of ground combat and simulation systems and the impact of changes in foreign currency exchange rates. For the nine-month period, operating income also decreased due to restructuring charges of $4.0 million incurred in the second quarter of 2015. These decreases were partially offset by increased operating income on increased sales of air combat training systems for the quarter and nine-month period.
Cash Flows
Operating activities provided cash of $46.5 million for the nine months ended June 30, 2015. The operating activities of CTS and CGD Services provided positive cash flows, while CGD Systems used cash. We invested $90.2 million to acquire DTECH LABs in the first nine months of 2015. A portion of this purchase was funded by draws on our U.S. revolving credit facility. At June 30, 2015, we had $70 million outstanding under this facility at a variable interest rate of 1.71 percent. We had capital expenditures of $15.7 million in the first nine months of fiscal 2015, including the acquisition of software licenses for the ERP system, which is currently under development.
Conference Call
Cubic management will host a conference call to discuss the company’s third quarter and nine-month results today, Thursday, August 6at 4:30 p.m. ET (1:30 p.m. PT) that will be simultaneously broadcast over the Internet. Bradley H. Feldmann, president and chief executive officer and John “Jay” D. Thomas, executive vice president and chief financial officer, will host the call.
Conference Dial-In Information
Financial analysts and institutional investors interested in participating in the call are invited to dial:
- 877-407-8293 for domestic callers
- 201-689-8349 for international callers
Please dial-in approximately 10 minutes prior to the start of the call.
Audio Webcast
Listeners may access the conference call live over the Internet at the company’s website under the “Investor Relations” tab at www.cubic.com.
Please allow 15 minutes prior to the call to visit our website to download any necessary audio software. For those unable to listen to the live broadcast, an archived version will be available at the same location for approximately 30 days following the live webcast.
About Cubic
Cubic Corporation designs, integrates and operates systems, products and services focused in the transportation, defense training and secure communications markets. Cubic’s mission is to increase situational awareness and understanding for customers worldwide. Cubic Transportation Systems is a leading integrator of payment and information technology and services to create intelligent travel solutions for public transit authorities and operators. Cubic Global Defense Services is a leading provider of highly specialized support services for military and security forces of the U.S. and allied nations. Cubic Global Defense Systems is a leading provider of realistic combat training systems, as well as secure communications and networking.
For more information about Cubic, see the company’s website at www.cubic.com.
Forward-Looking Statements
This press release contains forward-looking statements within the meaning of the Private Securities Litigation Reform Act of 1995 that are subject to the safe harbor created by such Act. Forward-looking statements include, among others, statements about our expectations regarding future events or our future financial and/or operating performance. These statements are often, but not always, made through the use of words or phrases such as “may,” “will,” “anticipate,” “estimate,” “plan,” “project,” “continuing,” “ongoing,” “expect,” “believe,” “intend,” “predict,” “potential,” “opportunity” and similar words or phrases or the negatives of these words or phrases. These statements involve risks, estimates, assumptions and uncertainties that could cause actual results to differ materially from those expressed in these statements, including, among others: our dependence on U.S. and foreign government contracts; delays in approving U.S. and foreign government budgets and cuts in U.S. and foreign government defense expenditures; the ability of certain government agencies to unilaterally terminate or modify our contracts with them; our ability to successfully integrate new companies into our business and to properly assess the effects of such integration on our financial condition; the U.S. government’s increased emphasis on awarding contracts to small businesses, and our ability to retain existing contracts or win new contracts under competitive bidding processes; the effects of politics and economic conditions on negotiations and business dealings in the various countries in which we do business or intend to do business; risks associated with the restatement of our prior consolidated financial statements, including our identification of material weaknesses in our internal control over financial reporting; competition and technology changes in the defense and transportation industries; our ability to accurately estimate the time and resources necessary to satisfy obligations under our contracts; the effect of adverse regulatory changes on our ability to sell products and services; our ability to identify, attract and retain qualified employees; business disruptions due to cyber security threats, physical threats, terrorist acts, acts of nature and public health crises; our involvement in litigation, including litigation related to patents, proprietary rights and employee misconduct; our reliance on subcontractors and on a limited number of third parties to manufacture and supply our products; our ability to comply with our development contracts and to successfully develop, introduce and sell new products, systems and services in current and future markets; defects in, or a lack of adequate coverage by insurance or indemnity for, our products and systems; and changes in U.S. and foreign tax laws, exchange rates or our economic assumptions regarding our pension plans. In addition, please refer to the risk factors contained in our SEC filings available at www.sec.gov, including our most recent Annual Report on Form 10-K and Quarterly Reports on Form 10-Q. Because the risks, estimates, assumptions and uncertainties referred to above could cause actual results or outcomes to differ materially from those expressed in any forward-looking statements, you should not place undue reliance on any forward- looking statements. Any forward-looking statement speaks only as of the date hereof, and, except as required by law, we undertake no obligation to update any forward-looking statement to reflect events or circumstances after the date hereof.
Use of Non-GAAP Financial Information
Adjusted EBITDA represents net income attributable to Cubic before interest, taxes, non-operating income, goodwill impairment charges, depreciation and amortization. We believe that the presentation of Adjusted EBITDA included in this report provides useful information to investors with which to analyze our operating trends and performance and ability to service and incur debt. Also, Adjusted EBITDA is a factor we use in measuring our performance and compensating certain of our executives. Further, we believe Adjusted EBITDA facilitates company-to-company operating performance comparisons by backing out potential differences caused by variations in capital structures (affecting net interest expense), taxation, the age and book depreciation of property, plant and equipment (affecting relative depreciation expense), goodwill impairment charges and non-operating expenses which may vary for different companies for reasons unrelated to operating performance. In addition, we believe that Adjusted EBITDA is frequently used by securities analysts, investors and other interested parties in their evaluation of companies, many of which present an Adjusted EBITDA measure when reporting their results. Adjusted EBITDA is not a measurement of financial performance under GAAP and should not be considered as an alternative to net income as a measure of performance. In addition, other companies may define Adjusted EBITDA differently and, as a result, our measure of Adjusted EBITDA may not be directly comparable to Adjusted EBITDA of other companies. Furthermore, Adjusted EBITDA has limitations as an analytical tool, and you should not consider it in isolation, or as a substitute for analysis of our results as reported under GAAP.
Because of these limitations, Adjusted EBITDA should not be considered as a measure of discretionary cash available to us to invest in the growth of our business. We compensate for these limitations by relying primarily on our GAAP results and using Adjusted EBITDA only supplementally. You are cautioned not to place undue reliance on Adjusted EBITDA.
The following table reconciles Adjusted EBITDA to net income attributable to Cubic, which we consider to be the most directly comparable GAAP financial measure to Adjusted EBITDA.