Results include record annual and quarterly sales; 8.3 percent growth in Adjusted EBITDA(1)
- Record sales of $1.431 billion for fiscal year 2015, and record quarterly sales of $425.9 million for the fourth quarter
- Net income of $22.9 million, or $0.85 per diluted share for the year, and net income for the fourth quarter of $20.0 million, or $0.74 per diluted share
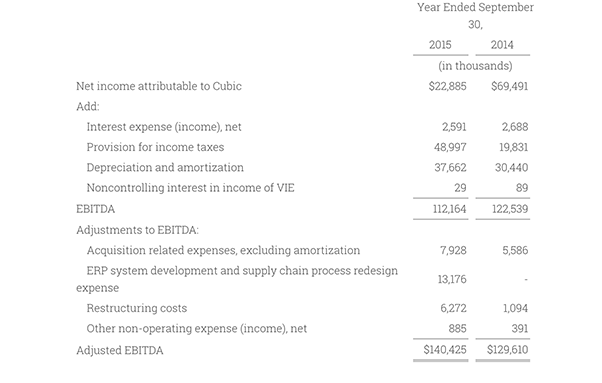
- EBITDA(1) of $112.2 million and Adjusted EBITDA(1) of $140.4 million for fiscal year 2015
- Cash provided by operating activities of $89.7 million for the year
- Total backlog of $2.976 billion as of September 30, 2015
- Sales guidance for fiscal 2016 of $1.450 billion to $1.500 billion; EPS guidance of $1.30 to $1.55 per diluted share; EBITDA(1) guidance of $85 million to $100 million, Adjusted EBITDA(2) guidance of $125 million to $140 million(3)
San Diego, Nov. 23, 2015 – Cubic Corporation (NYSE: CUB) today reported its financial results for the fourth quarter and fiscal year ended September 30, 2015.
Fourth Quarter Fiscal 2015
Fourth quarter sales of $425.9 million in 2015 were 7 percent higher than sales of $396.4 million in the corresponding quarter last year. Sales would have been higher absent the negative impact of $19.5 million on quarterly sales from changes in foreign currency rates. Sales from recent acquisitions for the fourth quarter of fiscal 2015 were $41.2 million compared to $16.2 million during the same quarter last year. Sales grew for the quarter from Cubic Global Defense Systems (CGD Systems), but decreased from both Cubic Transportation Systems (CTS) and Cubic Global Defense Services (CGD Services). The increase in CGD Systems sales for the fourth quarter was primarily due to sales of ground combat training systems and higher sales from acquired businesses. The decrease in CTS sales for the fourth quarter was primarily due to foreign currency rates, and the decrease in CGD Services sales for the fourth quarter was mainly caused by a lower number of Joint Readiness Training Center (JRTC) exercises.
Net income in the fourth quarter of 2015 was $20.0 million, or $0.74 per diluted share, a decrease of 39 percent from $32.8 million, or $1.22 per diluted share in the corresponding quarter last year. Net income in the fourth quarter of 2015 was significantly impacted by the increase in the effective tax rate for the quarter. The increase in the effective tax rate, which was primarily driven by the non-cash valuation allowance on deferred tax assets discussed below, decreased net income by $8.5 million or $0.31 per diluted share compared to the corresponding quarter last year. Operating income decreased 12 percent to $34.7 million for the fourth quarter of 2015 compared to $39.3 million in the fourth quarter of 2014. The decrease was primarily a result of previously announced accelerated expenditures related to strategic and IT system resource planning as part of One Cubic initiatives totaling $5.4 million for the fourth quarter of 2015. Foreign currency exchange rates reduced operating income by $3.1 million for the fourth quarter of 2015 compared to the corresponding quarter last year.
Full Year Fiscal 2015
Sales in fiscal year 2015 were $1.431 billion compared to $1.398 billion in 2014, an increase of 2 percent. Sales were significantly impacted by changes in foreign currency exchange rates. The average exchange rates between the prevailing currencies in Cubic’s foreign operations and the U.S. dollar had a negative impact on sales of 4 percent in 2015, or $52.1 million compared to 2014. Organic sales decreased 2 percent after the impact of currency exchange rates, while businesses acquired in 2015 and 2014 increased sales by $58.5 million. Sales increased for the year from both CGD Services and CGD Systems, but decreased from CTS, due to the currency exchange impact described above.
Operating income was $75.4 million for the year compared to $92.5 million in 2014, a decrease of 18 percent. Adverse foreign currency exchange rates had a negative impact of $7.8 million on operating income. Operating income was also impacted by $13.2 million of expenditures related to the ongoing ERP system development and supply chain process redesign, in addition to restructuring charges totaling $6.3 million and costs related to an audit committee investigation totaling $3.0 million. Operating income increased in 2015 for CTS, but decreased for CGD Services and CGD Systems.
Net income attributable to Cubic shareholders was $22.9 million for the year, or $0.85 per diluted share, compared to $69.5 million, or $2.59 per diluted share for fiscal year 2014. Net income in 2015 includes a non-cash valuation allowance on U.S. deferred tax assets of $35.8 million or $1.33 per diluted share.
EBITDA(1) decreased to $112.2 million in fiscal year 2015 from $122.5 million in 2014. Adjusted EBITDA(1), which excludes acquisition related expenses, expenses related to ERP system development and supply chain process redesign, restructuring costs, and other non-operating income and expenses, increased to $140.4 million in fiscal year 2015 from $129.6 million last year. The decrease in EBITDA is related to the decrease in consolidated operating income for the year described above. The increase in adjusted EBITDA is primarily attributable to the increase in operating income for CTS discussed below.
Total backlog was $2.976 billion at the end of fiscal year 2015, compared to $3.180 billion in the prior year, a decrease of $204 million. Changes in exchange rates between the prevailing currency in our foreign operations and the U.S. dollar as of the end of fiscal 2015, decreased backlog by approximately $155.9 million compared to September 30, 2014.The decrease in total backlog in CTS and CGD Services was partially offset by an increase in backlog for CGD Systems.
“We are pleased by this year’s increases in sales and Adjusted EBITDA, good cash flow and strong backlog despite foreign exchange headwinds. We have sharpened our strategy focus and are intensely pursuing NextCity, C4ISR and select training markets, while making essential investments in the company to drive increased productivity and efficiency,” said Bradley H. Feldmann, president and chief executive officer of Cubic Corporation.
(1) EBITDA and Adjusted EBITDA are Non-GAAP metrics - see the table included in the section titled “Use of Non-GAAP Financial Information” for a reconciliation of these GAAP and non-GAAP financial measures
(2) Our fiscal year 2016 guidance for Adjusted EBITDA adds back to EBITDA an estimated $34-$36 million of pretax expense related to our strategic investment in ERP and supply chain improvements and $4-6 million of pretax acquisition related expenses for businesses acquired before September 30, 2015.
(3) Key foreign exchange rates used in our forecasts of sales, EPS, EBITDA and Adjusted EBITDA compared to the U.S. dollar are as follows: British pound -- 1.55; Australian dollar -- 0.72; New Zealand dollar 0.65.
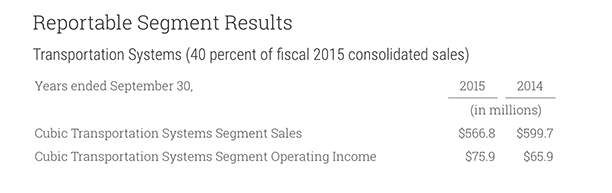
CTS sales decreased 5 percent to $566.8 million in 2015 compared to $599.7 million in 2014. Changes in foreign currency exchange rates had a significant adverse impact on sales. The average exchange rates between the prevailing currencies in CTS foreign operations and the U.S. dollar resulted in a decrease in CTS sales of $40.0 million for 2015 compared to 2014.
CTS operating income increased 15 percent in 2015 to $75.9 million compared to $65.9 million in 2014.The average exchange rates between the prevailing currency in our foreign operations and the U.S. dollar resulted in a reduction in CTS operating income of $5.5 million for 2015 compared to 2014. The increase in operating income compared to last year was primarily attributable to a decrease in losses on the Vancouver contract, an increase in gross margins on the contract in Chicago and a gain recognized on proceeds from a claim settlement of $3.6 million. These increases in operating income were partially offset by slightly lower margins on development and services work in the U.K.
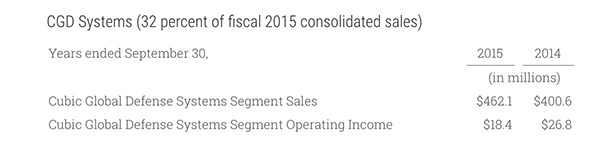
CGD Systems sales increased 15 percent to $462.1 million in 2015 compared to $400.6 million in 2014, despite a negative $12.1 million impact on sales from changes in foreign currency exchange rates. Businesses acquired by CGD Systems in fiscal years 2015 and 2014 contributed sales of $60.5 million in 2015 compared to $5.3 million in 2014.
CGD Systems operating income decreased 31 percent to $18.4 million in 2015 compared to $26.8 million in 2014, including a $2.2 million negative impact of foreign currency exchange rates. Increases in estimated costs to complete a contract for the development of a virtual training system resulted in losses of $9.5 million in 2015. While we expect to recover some amount of the costs related to the work performed outside of the scope of the contract through a contract claim process, at this time it is not possible to determine the amount that will be recovered. In addition, CGD Systems incurred $4.6 million of restructuring charges in fiscal 2015.
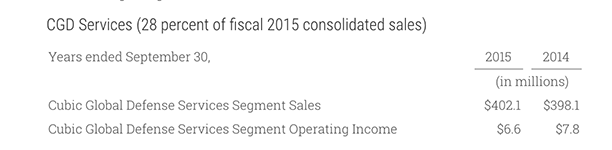
CGD Services sales increased 1 percent to $402.1 million in 2015 compared to $398.1 million in 2014. Although this slight upward movement in sales between the years appears to reflect little change, there was a significant change in the mix of sales. CGD Services realized higher sales in 2015 from a Marine Corps training contract won earlier in the fiscal year, from Special Operations Forces training and from growth in its simulator training operations. Sales were lower from training exercises at the JRTC, the Korea Battle Simulation Center (KBSC) and the Joint Warfighting Center (JWFC).
CGD Services operating income decreased to $6.6 million in 2015 from $7.8 million in 2014. Profit margins were lower in 2015 than in 2014 due in part to the change in mix of sales described above. Lower sales from the JRTC, KBSC and JWFC contracts resulted in lower operating income. In addition, CGD Services incurred higher compensation costs during the first quarter of fiscal 2015 as the result of recruiting new executive management. Lower operating income was partially offset by a $2.7 million decrease in amortization expense related to purchased intangible assets.
Cash Flows
Operating activities provided cash of $89.7 million in 2015 compared to $114.8 million in 2014. In 2015, CGD Services and CTS contributed to positive operating cash flows, while CGD Systems operations used cash.
Conference Call
Cubic management will host a conference call to discuss the company’s fourth quarter and fiscal year 2015 results tomorrow, Tuesday, November 24, 2015 at 1:00 p.m. ET/10:00 a.m. PT, that will be simultaneously broadcast over the Internet. Bradley H. Feldmann, president and chief executive officer and John “Jay” D. Thomas, executive vice president and chief financial officer, will host the call.
Conference Dial-In Information
Financial analysts and institutional investors interested in participating in the call are invited to dial:
- (877) 407-8293 for domestic callers
- (201) 689-8349 for international callers
Please dial-in approximately 10 minutes prior to the start of the call.
Webcast
A live webcast of the conference call and presentation slides will be accessible on our website under the “Investor Relations” tab at www.cubic.com.
Please visit the website at least 15 minutes prior to the call to register, download and install any streaming media software needed to listen to the webcast. A replay of the broadcast will be available on the Investor Relations tab of Cubic's website.
About Cubic
Cubic Corporation designs, integrates and operates systems, products and services focused in the transportation, defense training and secure communications markets. As the parent company of two major business units, Cubic’s mission is to increase situational awareness and understanding for customers worldwide. Cubic Transportation Systems is a leading integrator of payment and information technology and services to create intelligent travel solutions for transportation authorities and operators. Cubic Global Defense is a leading provider of realistic combat training systems, secure communications and networking and highly specialized support services for military and security forces of the U.S. and allied nations. For more information about Cubic, please visit the company's website at www.cubic.com or on Twitter @CubicCorp.
Forward-Looking Statements
This press release contains forward‐looking statements within the meaning of the Private Securities Litigation Reform Act of 1995 that are subject to the safe harbor created by such Act. Forward‐looking statements include, among others, statements about our expectations regarding future events or our future financial and/or operating performance; making investments in our company to drive increased productivity and efficiency in the future; anticipated lower sales, operating income and gross margin percentage in the future under our new contract with TfL; and the potential recovery of certain costs related to a contract for the development of a virtual training system. These statements are often, but not always, made through the use of words or phrases such as “may,” “will,” “anticipate,” “estimate,” “plan,” “project,” “continuing,” “ongoing,” “expect,” “believe,” “intend,” “predict,” “potential,” “opportunity” and similar words or phrases or the negatives of these words or phrases. These statements involve risks, estimates, assumptions and uncertainties that could cause actual results to differ materially from those expressed in these statements, including, among others: our dependence on U.S. and foreign government contracts; delays in approving U.S. and foreign government budgets and cuts in U.S. and foreign government defense expenditures; the ability of certain government agencies to unilaterally terminate or modify our contracts with them; our ability to successfully integrate new companies into our business and to properly assess the effects of such integration on our financial condition; the U.S. government’s increased emphasis on awarding contracts to small businesses, and our ability to retain existing contracts or win new contracts under competitive bidding processes; the effects of politics and economic conditions on negotiations and business dealings in the various countries in which we do business or intend to do business; risks associated with the restatement of our prior consolidated financial statements, including our identification of material weaknesses in our internal control over financial reporting; competition and technology changes in the defense and transportation industries; our ability to accurately estimate the time and resources necessary to satisfy obligations under our contracts; the effect of adverse regulatory changes on our ability to sell products and services; our ability to identify, attract and retain qualified employees; unforeseen problems with the implementation and maintenance of our information systems; business disruptions due to cyber security threats, physical threats, terrorist acts, acts of nature and public health crises; our involvement in litigation, including litigation related to patents, proprietary rights and employee misconduct; our reliance on subcontractors and on a limited number of third parties to manufacture and supply our products; our ability to comply with our development contracts and to successfully develop, introduce and sell new products, systems and services in current and future markets; defects in, or a lack of adequate coverage by insurance or indemnity for, our products and systems; and changes in U.S. and foreign tax laws, exchange rates or our economic assumptions regarding our pension plans. In addition, please refer to the risk factors contained in our SEC filings available at www.sec.gov, including our most recent Annual Report on Form 10‐K and Quarterly Reports on Form 10‐Q. Because the risks, estimates, assumptions and uncertainties referred to above could cause actual results or outcomes to differ materially from those expressed in any forward‐looking statements, you should not place undue reliance on any forward‐ looking statements. Any forward‐looking statement speaks only as of the date hereof, and, except as required by law, we undertake no obligation to update any forward‐looking statement to reflect events or circumstances after the date hereof.
Use of Non-GAAP Financial Information
We believe that the presentation of Earnings before interest, taxes, depreciation, and amortization (EBITDA) and Adjusted EBITDA included in this report provides useful information to investors with which to analyze our operating trends and performance and ability to service and incur debt. Also, we believe EBITDA facilitates company-to-company operating performance comparisons by backing out potential differences caused by variations in capital structures (affecting net interest expense), taxation, variations in organic vs. inorganic growth (affecting amortization expense) and the age and book depreciation of property, plant and equipment (affecting relative depreciation expense). We believe Adjusted EBITDA further facilitates company-to-company operating comparisons by backing out items that we believe are not part of our core operating performance. Items backed out of Adjusted EBITDA are comprised of expenses incurred in the development of our ERP system and the redesign of our supply chain, business acquisition expenses including retention bonus expenses, due diligence and consulting costs incurred in connection with the acquisitions, expenses recognized related to the change in the fair value of contingent consideration for acquisitions, restructuring costs, and income and expenses classified as other non-operating income and expenses which may vary for different companies for reasons unrelated to operating performance.
In addition, EBITDA and Adjusted EBITDA are key drivers of the company’s core operating performance and major factors in management’s bonus compensation each year. Management has excluded the effects of these items in these measures to assist investors in analyzing and assessing our past and future core operating performance.
In addition, we believe that EBITDA and Adjusted EBITDA are frequently used by securities analysts, investors and other interested parties in their evaluation of companies, many of which present EBITDA, Adjusted EBITDA and/or other adjusted measures when reporting their results.
EBITDA and Adjusted EBITDA are not measurements of financial performance under GAAP and should not be considered as alternatives to net income as a measure of performance. In addition, other companies may define EBITDA and Adjusted EBITDA differently and, as a result, our measures of EBITDA and Adjusted EBITDA may not be directly comparable to EBITDA and Adjusted EBITDA of other companies. Furthermore, EBITDA and Adjusted EBITDA have limitations as analytical tools, and you should not consider either of them in isolation, or as a substitute for analysis of our results as reported under GAAP.
Because of these limitations, EBITDA and Adjusted EBITDA should not be considered as measures of discretionary cash available to us to invest in the growth of our business. We compensate for these limitations by relying primarily on our GAAP results and using EBITDA and Adjusted EBITDA only supplementally. You are cautioned not to place undue reliance on EBITDA or Adjusted EBITDA.
The following table reconciles EBITDA and Adjusted EBITDA to net income attributable to Cubic, which we consider to be the most directly comparable GAAP financial measure to EBITDA and Adjusted EBITDA.